A/B testing for widgets: what It Is, why It matters, best practices, and use cases
A/B testing allows you to compare different versions of a widget to see which one performs better with your audience. It’s often used to evaluate changes in copy, calls to action, images, layout, or offers, with the goal of increasing engagement or conversions.
In Getsitecontrol, A/B testing is designed to help you improve the effectiveness of your widgets by measuring real user interactions under the same conditions.
What is A/B testing?
A/B testing is a method used to compare different versions of a widget. The versions are shown to different but equal groups of visitors at the same time to measure how each one performs.
All widget versions must behave in the same way: they appear on the same pages, with the same timing, for the same audience. This ensures that performance differences are caused by changes in the widget itself rather than differences in audience or timing.
By keeping all other conditions the same, A/B testing reduces the effect of traffic changes or seasonal trends. The more data the test collects, the more reliable the results become, as a larger data sample reduces the impact of random fluctuations.
Why should you A/B test widgets?
A/B testing widgets helps you identify which version drives more clicks, sign-ups, and other key actions. By choosing the better-performing variant based on real user behavior, you can increase conversions and ultimately generate more revenue.
With A/B testing, you can make data-driven decisions about widget design and messaging instead of relying on intuition or assumptions. Because the impact of changes in wording, layout, or visual elements is not always predictable, testing variants against each other helps identify what actually drives higher engagement and conversion rates.
When used repeatedly over time, A/B testing supports ongoing optimization based on previous results.
How A/B testing works in Getsitecontrol
Test setup
In Getsitecontrol, you can run a maximum of five A/B tests simultaneously. When you want to run a test, you simply add all the relevant widget variants to the same test, and the test will automatically start.
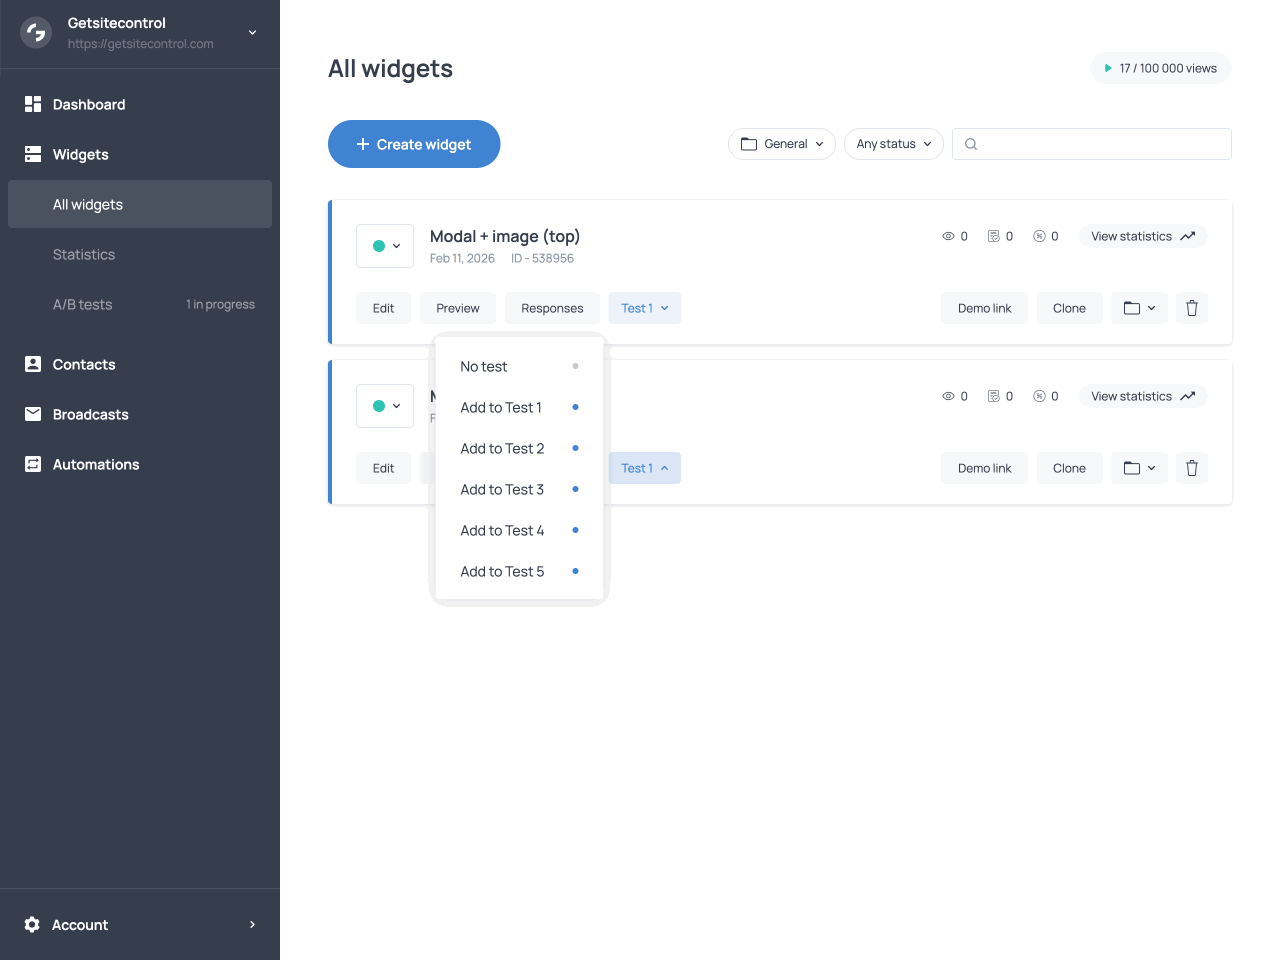
Adding a widget to an A/B test in Getsitecontrol
Variant assignment and targeting
Getsitecontrol splits traffic evenly among widget variants. Each visitor is randomly assigned a variant and will continue to see the same one for the duration of the test. A different variant may be assigned if the visitor uses a different browser or device, clears site data, or opens the site in incognito mode.
Variant assignment occurs as soon as the site loads, before targeting conditions are evaluated. As a result, a variant may be assigned to a visitor even if they do not meet its targeting conditions. For this reason, all variants must use identical targeting settings to ensure an even distribution of views.
Test execution and data collection
The test runs continuously until you decide to stop it. During this time, Getsitecontrol collects performance data for each variant and displays it in the A/B tests tab of the dashboard.
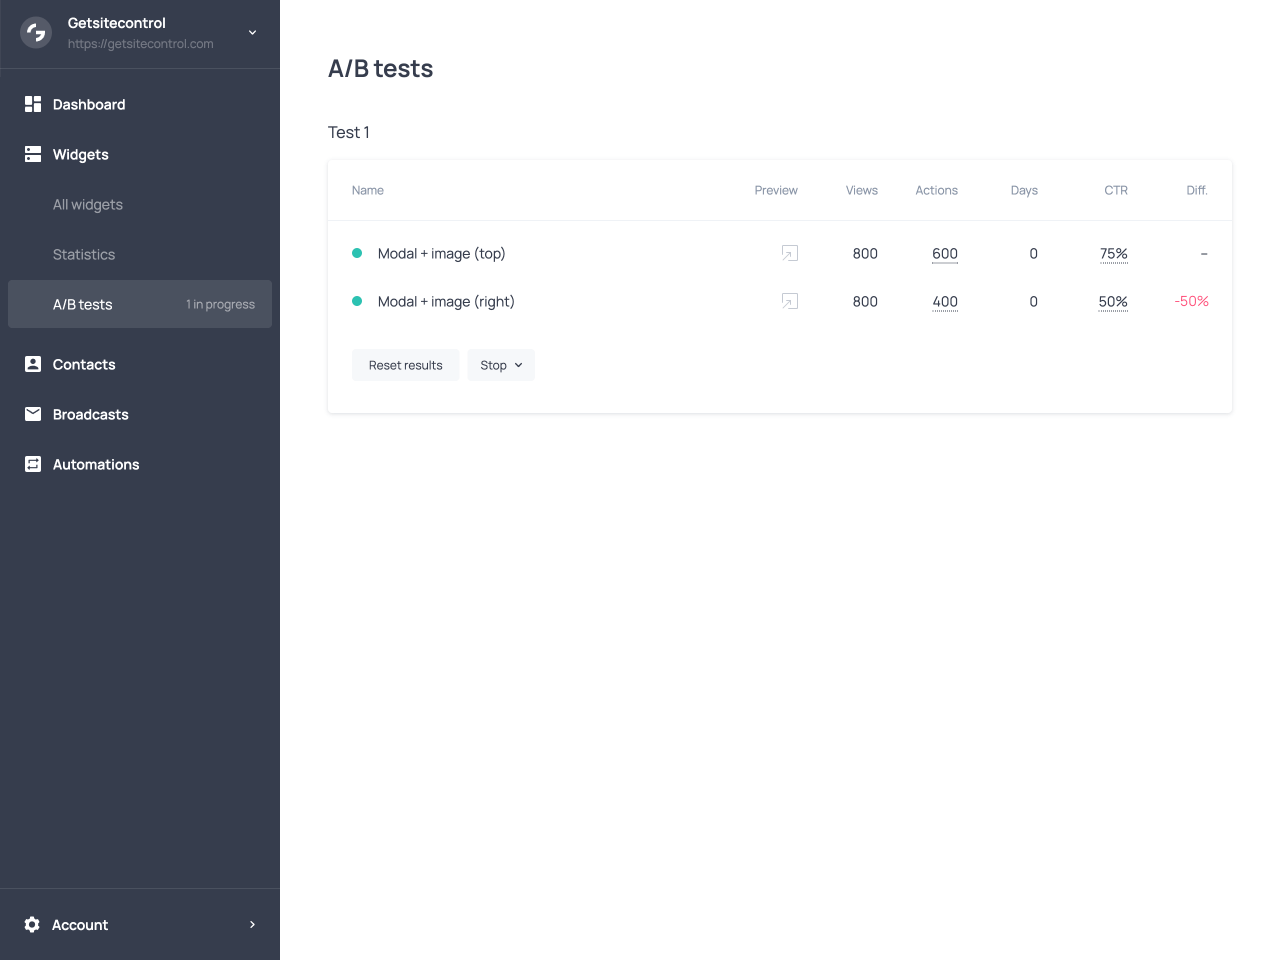
Example of running A/B test with data collected over time
A/B test metrics and their meaning
Getsitecontrol provides several metrics to evaluate the performance of widget variants. Each metric represents a different aspect of user interaction.
Views
Views show how many times visitors have seen a widget variant. Multiple views by the same visitor are counted separately. This metric confirms that traffic is distributed evenly across variants.
Actions
Actions represent interactions with the widget, such as submitting forms or opening links. A widget can have multiple actions, and this metric shows their combined total and a breakdown by action.
Days
Days indicate how long the test has been running. This helps put results into context and determine whether Getsitecontrol has collected enough data to draw conclusions.
CTR
The Click-Through Rate or CTR is the percentage of views that resulted in an action. It is calculated by dividing the total number of actions by the number of views.
Diff.
The difference shows the performance gap between variants, expressed as a percentage. This metric highlights how much better or worse one variant performs compared to another.
Interpreting metrics
CTR is the primary metric used to compare widget effectiveness. However, when widgets have multiple actions configured, the CTR reflects all actions combined. It’s important to focus on the CTR of the main action you intend to track and compare it with the same action across other variants. Secondary actions, such as link clicks, can increase the overall CTR of a variant and distort results if they are not relevant to your goal. The CTR metric includes a breakdown by action, allowing you to compare variants based on the action that matters most.
Lastly, when reviewing test metrics, it is important to consider both the CTR and the number of views. Large differences in CTR based on small sample sizes may not be reliable. Looking at all available metrics together provides a clearer picture of widget performance.
Best Practices for Running A/B Tests
Choosing Variables
Each A/B test should focus on changing only one variable at a time. This could be a headline, a button label, an image, or a call to action. Testing multiple changes in a single variant makes it difficult to understand which change affected performance.
Before starting a test, define a clear hypothesis. For example, changing the call-to-action text will increase the click-through rate because it communicates value more clearly.
Recommended test duration
The ideal test duration depends on traffic volume and business context. For high-traffic websites, meaningful results may appear within a few days. For lower-traffic sites, tests often need to run for one to two weeks or longer.
As a general guideline, a test should run long enough to capture usual traffic patterns, including variations by day of the week or time of day. Industry-specific traffic patterns, such as weekday-only activity or seasonal campaigns, should also be taken into account.
When and how to end a test
When performance differences remain consistent over time and across a sufficient number of views, you can stop the test. At this point, you keep running only the best-performing widget and deactivate or delete all the other versions.
If results are inconclusive, consider reviewing your hypothesis or testing a different variable in a new A/B test. Inconclusive results sometimes simply indicate that the tested change did not have a meaningful impact on user behavior.
| A/B testing principle | What it helps you achieve |
|---|---|
| Test one variable at a time | Makes it clear which specific change affected widget performance. |
| Use identical targeting for all variants | Ensures results are based on widget changes, not audience differences. |
| Split traffic evenly | Allows fair comparison between widget variants. |
| Run tests long enough | Leads to reliable results by reducing the impact of random fluctuations. |
| Measure consistent metrics | Allows accurate comparison using views, actions, and click-through rate. |
A/B testing use cases
A/B testing can be used to evaluate many aspects of a widget, from wording and layout to the type of offer shown. The following examples illustrate common use cases and show how small, focused changes can be tested to measure their impact on user behavior.
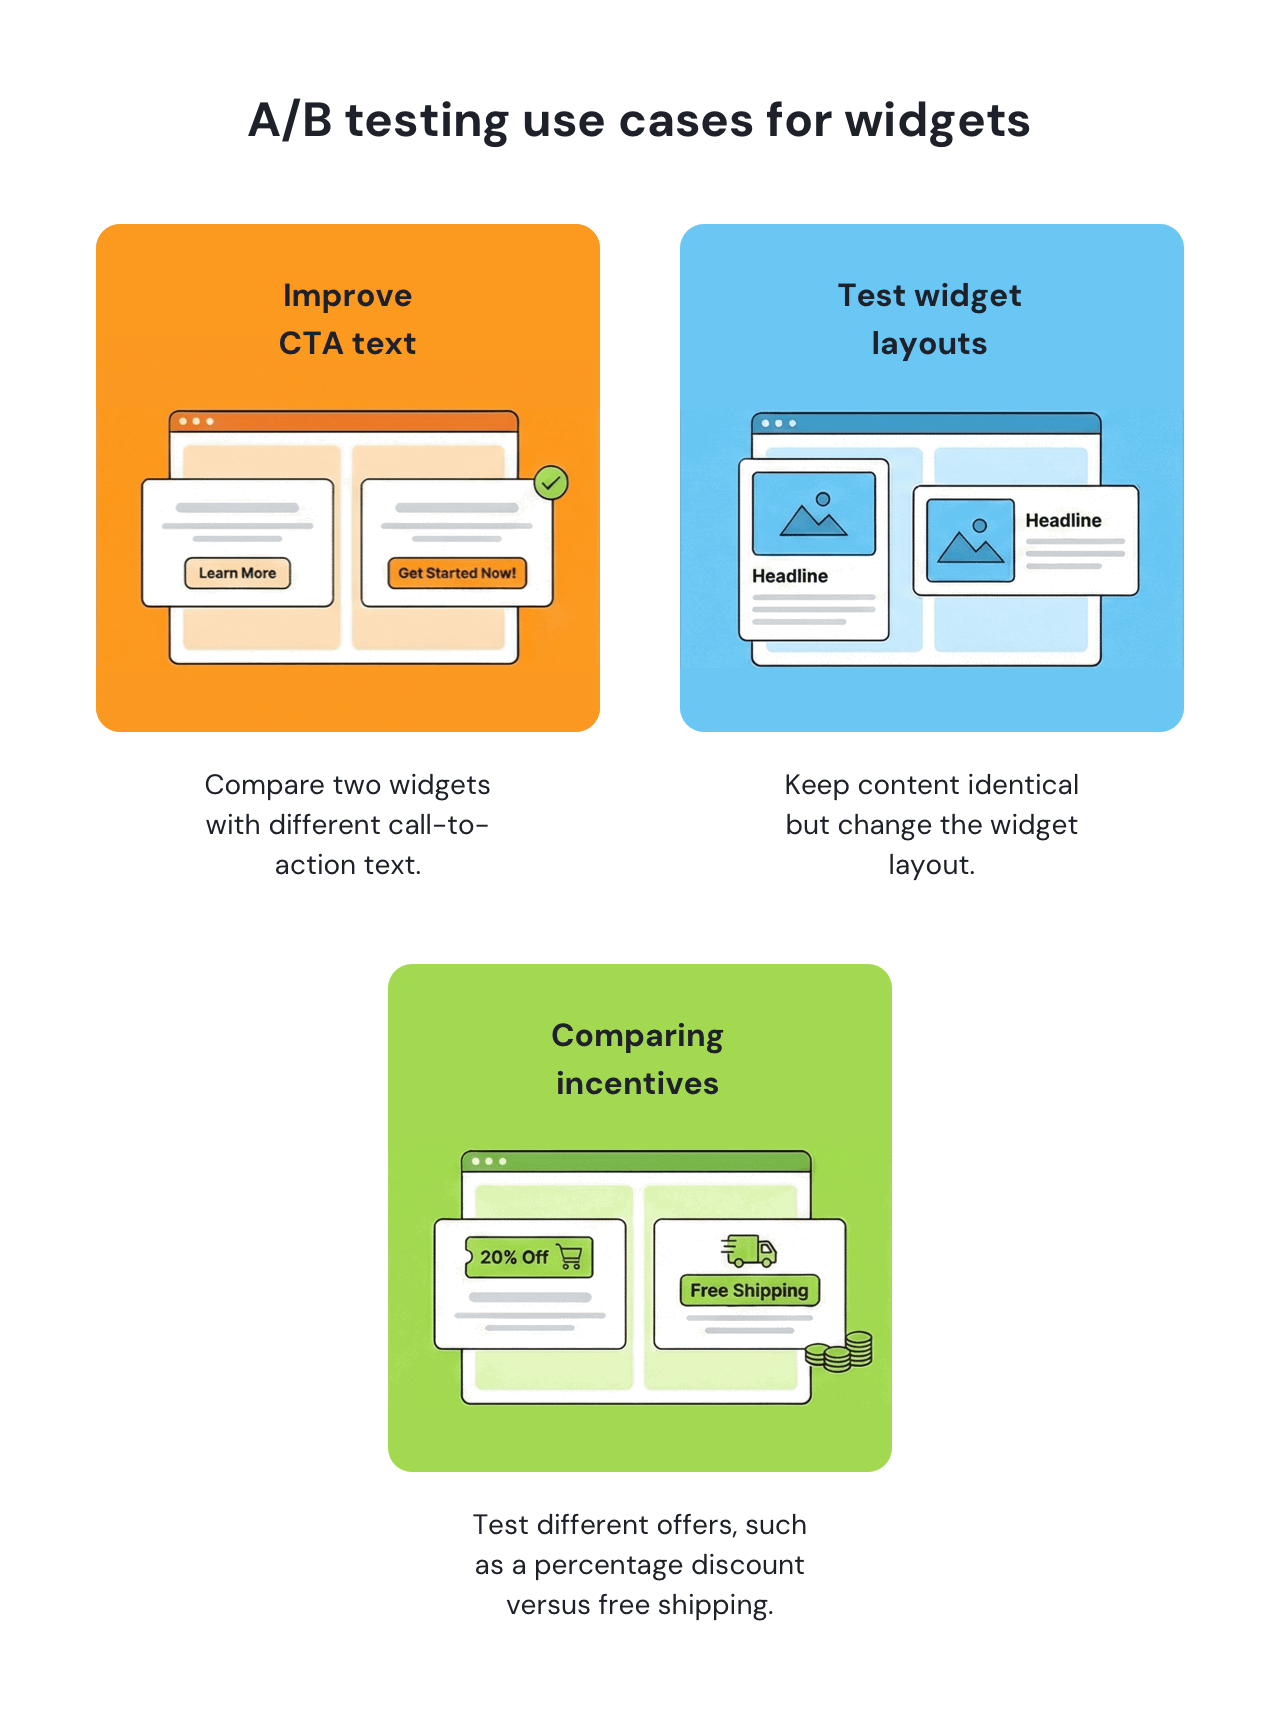
Improving CTA text
This test compares two widgets with different call-to-action text. Both versions are shown to the same audience under identical conditions. The goal is to identify which wording leads to more user actions.
Testing layouts
In this test, the widgets have identical content but a different layout. In one variant, the image is beside the text, while in the other it’s placed above it. The test measures how layout affects user engagement.
Comparing incentives
This use case compares two different incentives offered in the widget. One version promotes a percentage discount, the other promotes free shipping. The goal is to see which offer motivates users to act more.
Summary
A/B testing in Getsitecontrol allows you to compare widget variants under the same conditions and measure their performance using consistent metrics. Reliable results depend on testing one variable at a time, collecting enough data, and interpreting metrics together rather than in isolation. When used regularly, A/B testing supports ongoing, data-driven optimization of widget performance.