A/B testing broadcasts: variant setup, metric evaluation, and intelligent winner selection
A/B testing is a method for comparing multiple versions of a broadcast before delivering it to your selected audience. Rather than committing to a single version upfront, you send each variant to a percentage of your recipients first, collect engagement data during a defined waiting period, and then deliver the best-performing version to everyone else. This approach removes guesswork from campaign decisions and gives you a data-driven way to improve open rates, click rates, and overall inbox placement.
Small differences in a subject line, sender name, or email layout can produce very different engagement outcomes across a large audience. A/B testing helps you identify those differences early, so the version that reaches most of your recipients is already the one most likely to be opened and acted on. Over time, the engagement patterns you observe across multiple tests also help you understand what resonates with your audience.
The following sections explain how A/B testing works in practice, from creating variants and splitting your audience to automatic performance evaluation, winner selection, and reviewing the results. A/B testing is only available on paid subscription plans.
Variant setup
A/B testing is configured from the Broadcasts tab by switching the Enable A/B test toggle on a broadcast’s card. Once you enable the toggle, the broadcast becomes Variant A in the test, and you can create additional variants using the + Add variant option. The new variant is created as a copy of Variant A. An A/B test can include up to three variants.
A common workflow is to finalize your Variant A, clone it, and then modify the elements you want to test. This approach ensures that only intended differences exist between variants.
There are no predefined constraints on what can differ between variants. You can change the subject line, preview text, sender name, sender domain, or the entire email body, including its layout, content, and calls to action. You can also test combinations of these elements within the same campaign. This flexibility allows you to run focused tests, such as comparing subject lines while keeping everything else identical, as well as broader tests where the content and inbox elements differ substantially between versions.
If you disable A/B testing before launching the broadcast but after creating multiple variants, Variant A will revert to being the main broadcast, and any additional variants will be permanently deleted.
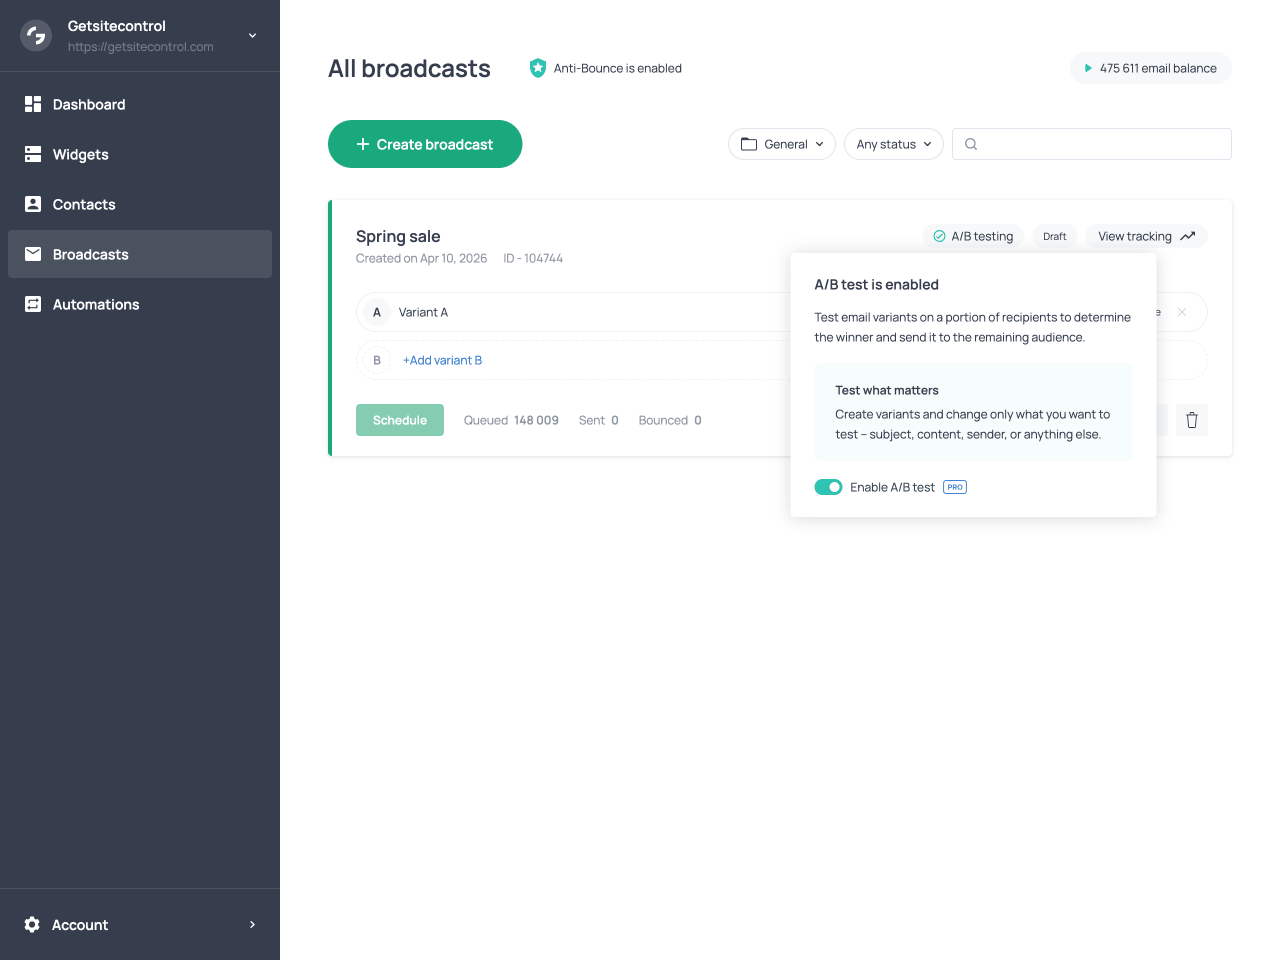
Broadcast card with A/B test enabled and the Add variant button visible
Audience split
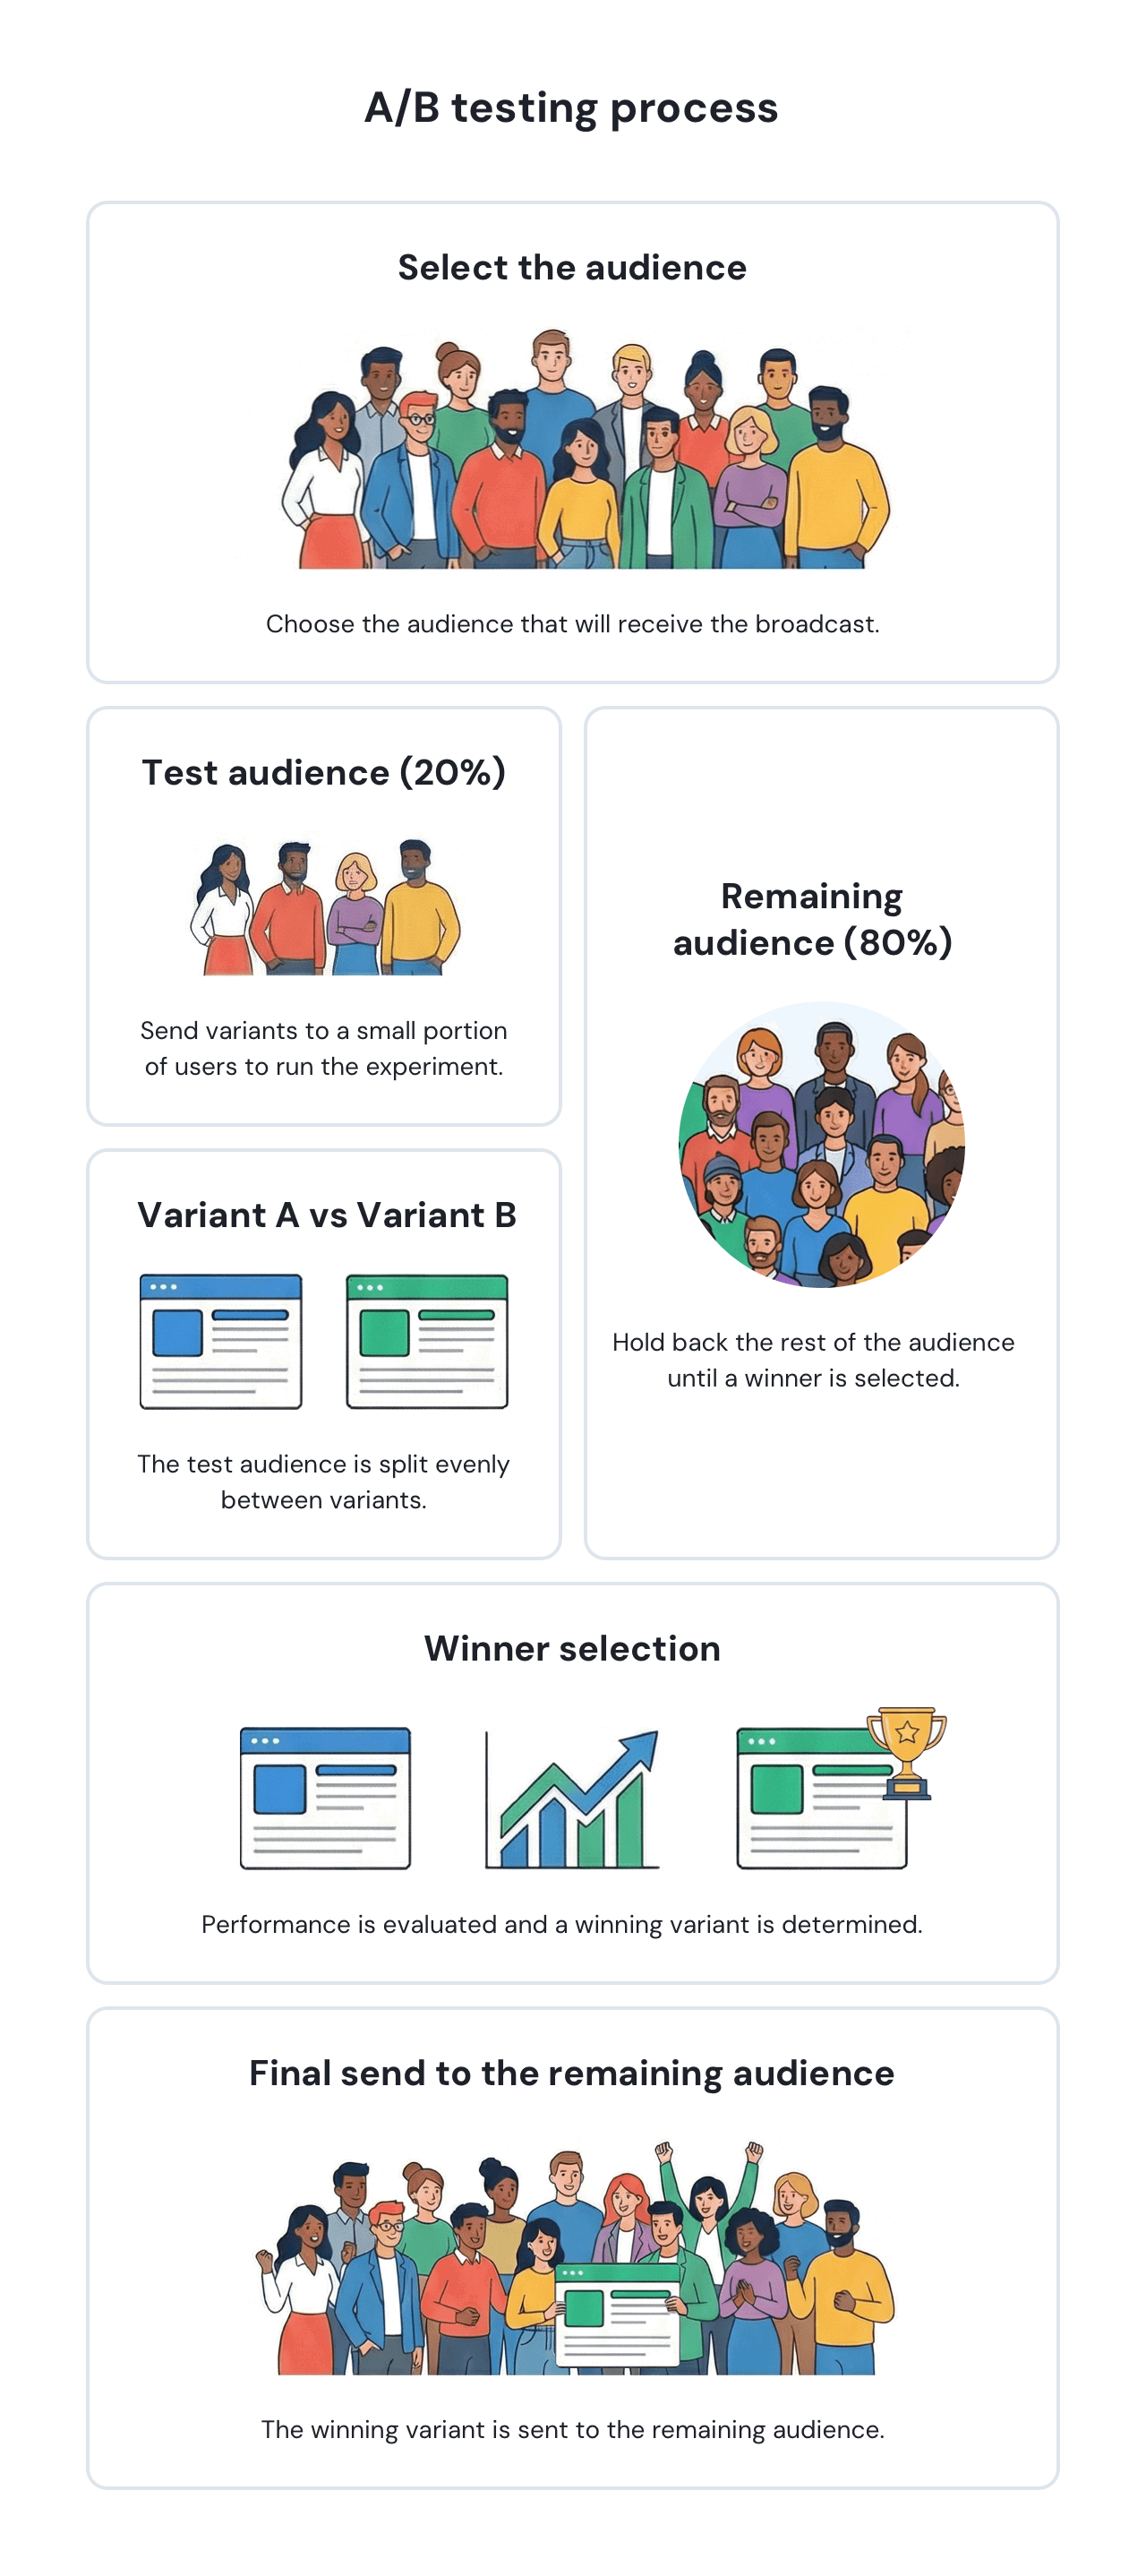
When you launch an A/B test, the audience selected for the broadcast is divided into two groups: a test group and a main group. The test group is the portion of the audience assigned to the test and receives the email variants. You define this portion as a percentage in the scheduling settings, after selecting the audience for the broadcast. For example, you might set 20% or 30% of the selected audience as the test group.
The main group is the remainder of the audience. These contacts do not receive any email during the test phase; when the test concludes, they receive the winning variant instead.
The test group is split evenly across all variants. For example, if you have 1,000 recipients, assign 20% to the test, and create two variants, each variant goes to 100 contacts. The remaining 800 contacts form the main group and receive the winning version after the evaluation period ends.
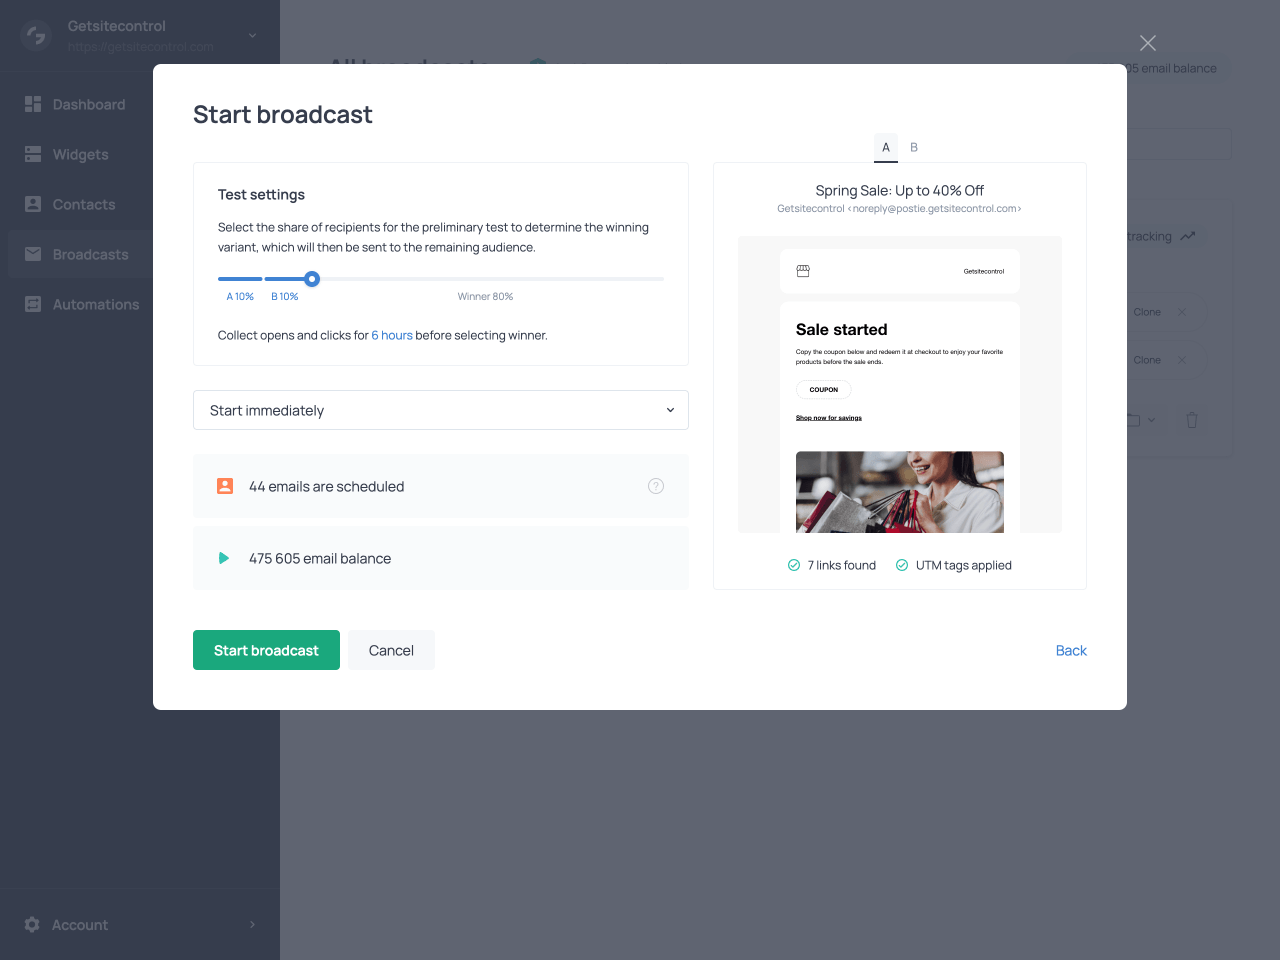
Defining the size of the test group in the scheduling settings of the broadcast
To ensure the results are meaningful, the system distributes contacts randomly across variants with attention to mailbox provider balance. This means that the group receiving each variant will include a mix of Gmail, Yahoo, Outlook, and other provider addresses. This prevents provider-specific factors from skewing the comparison.
A/B tests in Getsitecontrol can run even with relatively small audiences, but the portion of recipients assigned to the test phase should be chosen carefully. For smaller recipient lists, assigning a larger portion of the audience to the test phase often produces more reliable results, since engagement signals from very small samples can fluctuate significantly. Larger lists typically require a smaller percentage to generate meaningful comparisons, as even a modest test group can include hundreds or thousands of contacts.
Metric for comparison
One of the distinctive aspects of A/B testing in Getsitecontrol is that the system determines which metric to use for comparison automatically, based on what actually differs between the variants. You do not select a metric manually; the platform inspects the variants and applies the most appropriate metric based on the elements that differ between them. This logic works as follows.
Testing email body only
If the variants differ only in the email body, meaning the content, layout, design, or calls to action, but share the same subject line, preview text, and sender information, the system evaluates performance using click rate. Click rate is calculated as the number of clicks divided by the number of delivered emails.
When the inbox elements are identical, recipients decide whether to open the email based on the same information. Differences in open rates between variants would therefore not be meaningful indicators of body content performance. Clicks, on the other hand, are driven by what recipients find inside the email, making click rate the appropriate signal.
Testing inbox elements only
If the variants differ only in inbox elements, such as the subject line, preview text, sender name, or sender domain, but use the same email body, the system evaluates performance using open rate. Open rate is calculated as the number of opens divided by the number of delivered emails.
Here the logic is reversed. Since recipients see identical email content once they open the message, differences in click behavior would not reflect the impact of the inbox elements being tested. Open rate captures exactly what inbox elements influence: whether the recipient chooses to open the email at all.
Testing mixed elements or identical variants
If the variants differ in both inbox elements and body content, or if no differences are detected between them, the system applies a combined metric. This is calculated as a combined score where open rate contributes 40% and click rate contributes 60%. The higher weight on click rate reflects its value as a signal of deeper engagement.
| What differs between variants | Metric selected for comparison |
|---|---|
| Only the email body differs (content, layout, design, calls to action) | Click rate (clicked emails / delivered emails) |
| Only inbox elements differ (subject line, preview text, sender name, sender domain) | Open rate (opened emails / delivered emails) |
| Both inbox elements and email body differ, or no meaningful differences are detected | Combined engagement score (open rate 40% + click rate 60%) |
Evaluation period
The evaluation period is configured in the scheduling settings before the broadcast is launched. It can be set to 1, 6, 12, 18, or 24 hours. During this time, the system waits before evaluating the performance of the test variants.
The appropriate waiting period depends on the type of campaign you are sending. Time-sensitive broadcasts, such as limited promotions or announcements tied to a specific event, may benefit from shorter evaluation periods so the main send can occur quickly. For standard newsletters or marketing campaigns, allowing more time can produce a more reliable picture of recipient engagement, since many opens and clicks occur several hours after delivery.
Once all test emails have been sent, the countdown begins. The timer starts from the moment the last test email is delivered, not from the moment you launched the broadcast.
The waiting period is necessary because recipient engagement does not happen immediately after delivery. Some contacts open emails hours after receiving them, and clicks may be delayed even further. Allowing sufficient time before evaluating results ensures that the data reflects genuine recipient behavior rather than a partial snapshot.
Winner selection
Intelligent winner selection
At the end of the waiting period, the system intelligently evaluates each variant’s score according to the metric selected for the test. The variant with the highest score wins and is delivered to the main group. If two or more variants produce identical scores, the system resolves the tie in favor of the first variant in the list. If no email from a given variant was successfully delivered, that variant’s score is treated as zero.
Manual winner selection
You are not required to wait for the evaluation period to end. At any point during the test phase or the evaluation period, you can select a winner manually using the Choose winner option on the broadcast card. When you do this, the system does not apply the intelligent metric-based evaluation. It simply sends the variant you have chosen to the remaining audience immediately.
Manual selection is useful when results are already clear before the waiting period concludes, or when timing is critical and you need the main send to go out without delay.
Sending behavior during a test
All A/B tests are sent using the Burst mode with Traffic balancing enabled. This is set automatically and cannot be changed. Burst delivers emails at maximum speed, ensuring the test group receives their variants quickly so the evaluation period can begin.
Traffic balancing is enabled alongside Burst to protect sender reputation during the test. With Traffic balancing active, more engaged contacts are prioritized first, while less engaged contacts are introduced gradually. Delivery is also spread across major mailbox providers to avoid concentrating traffic toward a single provider. This combination maintains fast delivery while reducing the risk of triggering spam filters.
Viewing test performance
Getsitecontrol provides several views for tracking how an A/B test is performing, both during the test phase and after the winning variant has been delivered to the main group. Depending on what you need to evaluate, you can check per-variant statistics directly on the broadcast card, or open the tracking panel for a more detailed breakdown of the sending process and engagement data.
Variant statistics on the broadcast card
Performance metrics are visible directly on the broadcast card, next to each variant. These per-variant statistics include open rate, click count, and click-to-open rate (CTOR), and reflect the performance of that specific variant only. For the winning variant, these figures also include its delivery to the main group after the test phase concludes.
At the bottom of the broadcast card, a separate set of statistics represents the broadcast as a whole. These are the combined figures across all variants during the test phase, plus the performance of the winning variant when it was sent to the remaining audience, all aggregated into a single set of numbers.
Both the per-variant statistics and the overall broadcast metrics include a More dropdown menu that provides additional delivery and engagement data. This menu displays metrics such as Sent, Delivered, Bounced, Opened, Clicked, Unsubscribed, and Marked as spam. Many of these metrics are interactive: selecting a metric opens the list of contacts associated with that event.
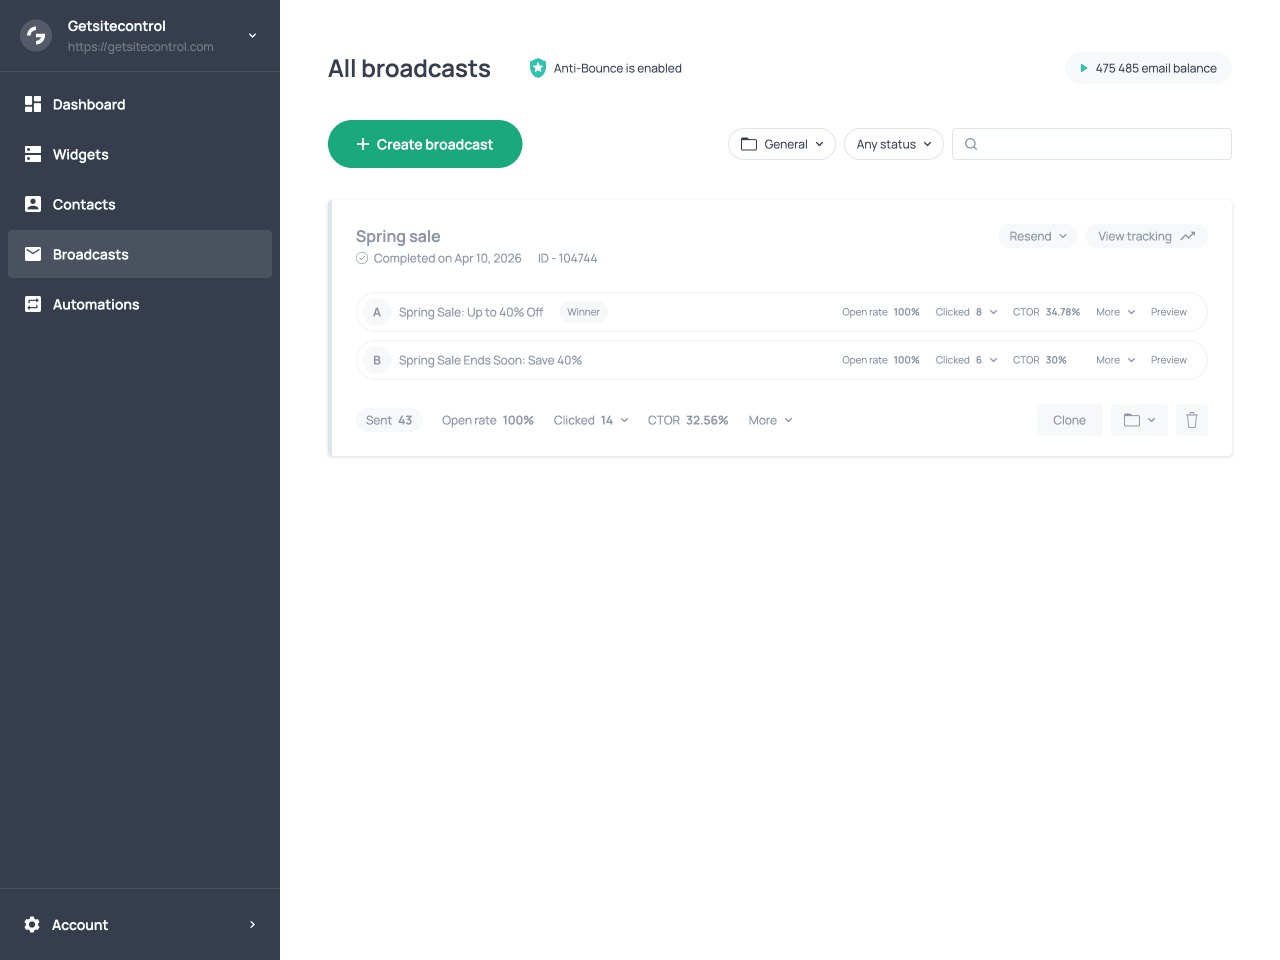
Broadcast card with variants, their performance metrics, and the general statistics
Sending timeline in the tracking panel
Clicking View tracking on the broadcast card opens a side panel with a more detailed view of the sending process. At the top of the panel, counters show the number of emails queued, sent, and bounced, updating in real time while the broadcast is running.
The panel displays a timeline of key stages in the sending process, including when the broadcast started, when the compliance check was completed, when audience segmentation was applied, and when the A/B testing phase was performed. Under the A/B testing entry in the timeline, you can see open rate, click count, and CTOR for each variant. These figures reflect only what happened during the test phase itself. The performance of the winning variant after it was sent to the main group is not included here, so this view is specifically useful for evaluating how the variants compared against each other during the test.
At the bottom of the panel, the Live report section shows real-time engagement data, including counts and percentages for opens, clicks, unsubscribes, and spam reports across the entire broadcast. Each metric can be expanded to view the individual contacts associated with that interaction.
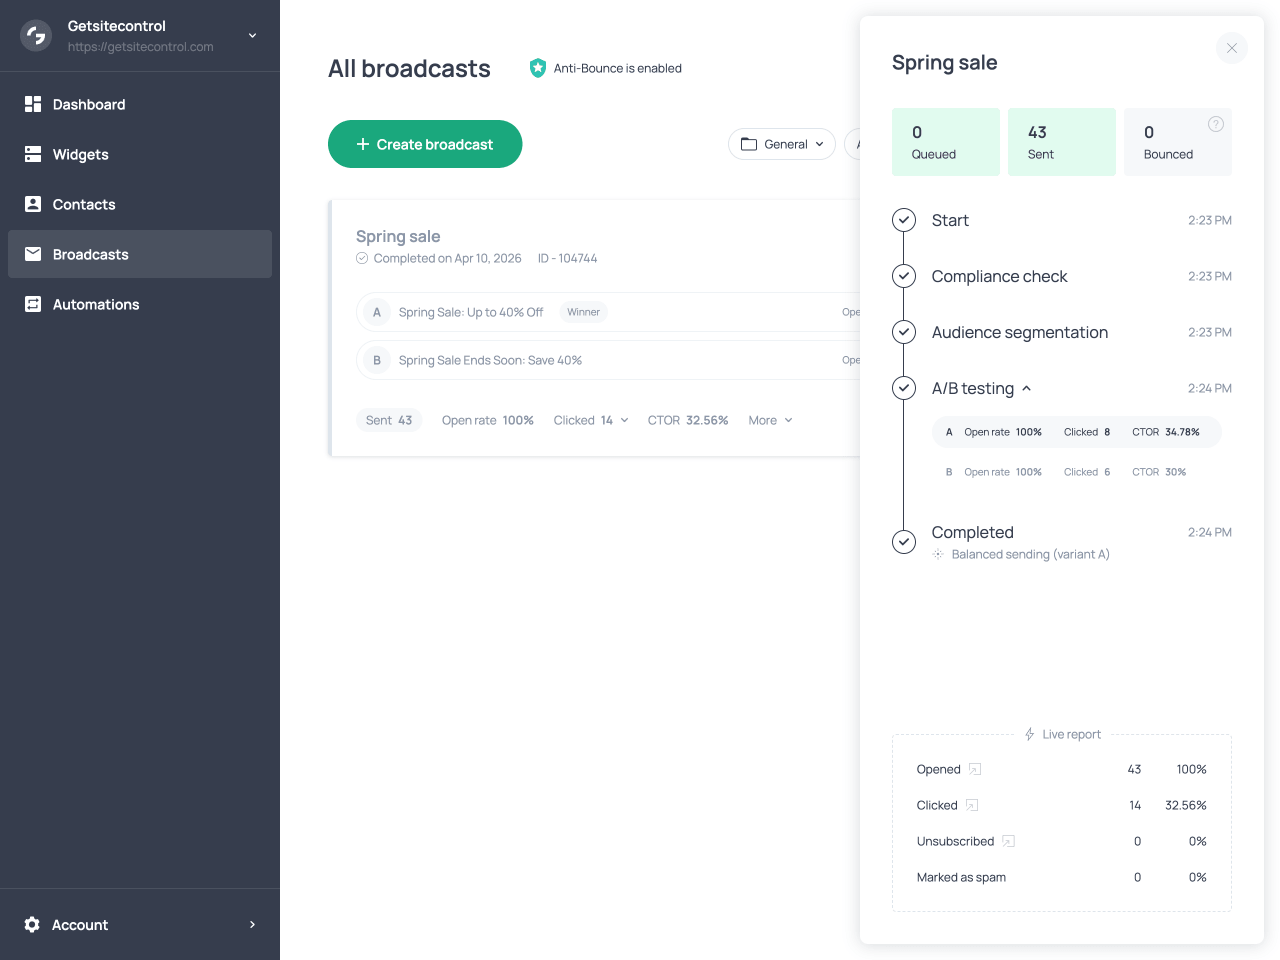
The tracking panel with the A/B testing stage in the timeline and variant metrics
A/B testing workflow
| Stage | What happens |
|---|---|
| Variant setup | You create up to three variants of a broadcast to test different elements. |
| Test configuration | Before launching the broadcast, you choose what percentage of recipients will participate in the test and how long the evaluation period will last. |
| Metric selection | The system automatically selects the comparison metric based on what differs between the variants. |
| Test phase | The variants are sent to the test group. The audience is split evenly across variants, and each sample includes a balanced mix of mailbox providers. |
| Evaluation period | After all test emails are delivered, the system collects engagement data for the configured period before evaluating results. |
| Winner selection | The system evaluates variant performance based on the chosen metric and sends the winning version to the remaining audience. |
| Viewing performance | You can review variant performance and overall broadcast results on the broadcast card and in the tracking panel. |
What to A/B test
A/B testing is most effective when it focuses on elements that influence how recipients interact with your email. In practice, these elements fall into two main categories: inbox elements, which affect whether recipients open the email, and email content, which affects what they do after opening it.
Testing inbox elements
Inbox elements are the pieces of information recipients see before opening your email. These include the subject line, preview text, sender name, and sender domain. Because these elements shape the first impression of your message, small changes can produce meaningful differences in open rates.
Subject line tests are one of the most common use cases for A/B tests. You might compare a direct subject line against one that creates curiosity, or test the impact of including personalization or emojis. Preview text can also influence open behavior, especially when it expands on the subject line or highlights a specific benefit.
The sender name is another element worth testing. Some audiences respond better to emails sent from a recognizable brand name, while others engage more when messages appear to come from a person.
Testing email content
Once a recipient opens the email, engagement depends on the content inside it. Changes to the layout, visual hierarchy, messaging, and calls to action can all influence click behavior. For example, one variant might emphasize a single primary offer with a prominent call to action, while another might present multiple products or content blocks. You might also test different call-to-action wording, placement, or button styles.
Since these elements affect what recipients encounter after opening the email, differences between such variants are typically reflected in click behavior rather than open behavior.
Focused tests vs broader comparisons
When designing a test, you can choose between focused experiments and broader comparisons. A focused test changes only one element at a time, such as comparing two subject lines while keeping everything else identical. This approach makes it easier to understand exactly which change influenced the results.
A broader comparison might involve testing two substantially different email designs or messaging strategies. While this makes it harder to isolate the exact reason for performance differences, it can help determine which overall approach resonates most with your audience.
Both strategies can be useful. Focused tests provide clearer insights about individual elements, while broader comparisons can help identify the most effective campaign format overall.
Best practices for A/B testing
Thoughtful test design ensures that A/B testing produces meaningful insights rather than random fluctuations in engagement data. The practices below can help you design tests that produce clearer and more reliable results.
Limit the number of variables when possible
When your goal is to understand how a specific element performs, it is usually best to change only one major variable between variants. For example, if you are testing subject lines, keeping the email body identical across variants ensures that any differences in engagement can be attributed to the subject line itself.
Use a sufficiently large test group
Very small test groups can produce results that are heavily influenced by chance. Assigning a larger portion of your audience to the test phase generally produces more reliable engagement signals and clearer differences between variants. The optimal size of the test group depends on the total audience size, but ensuring each variant reaches a meaningful number of recipients produces more stable results.
Allow enough time for evaluation
The evaluation period should be long enough to capture meaningful engagement data. While some recipients open emails immediately, others may do so hours after delivery, and clicks may occur even later. Choosing a longer evaluation period generally produces more reliable results because it allows engagement patterns to develop fully before a winner is selected. For time-sensitive campaigns, shorter evaluation periods are acceptable.
Run tests consistently
Running tests regularly allows you to gather comparable results across multiple campaigns. This makes it easier to confirm whether changes in subject lines, content formats, or messaging consistently improve engagement.
Long-term benefits
While the immediate goal of A/B testing is to identify the best-performing variant for a specific broadcast, the insights gathered across multiple tests can also shape how your email strategy evolves.
Improving future campaign strategy
Over time, engagement data from multiple tests reveals patterns in audience behavior. You may notice that certain subject lines consistently produce better open rates, that specific calls to action generate more clicks, or that certain email structures lead to more engagement. These insights can guide how you design new broadcasts. Instead of relying on intuition, you can use patterns observed in past tests to shape subject lines, messaging strategies, and content layouts that are more likely to resonate with your audience.
As these insights accumulate, campaigns become easier to design and more predictable in their performance. In this way, A/B testing functions not only as a method for selecting a winning variant in a single campaign, but also as a mechanism for refining your overall email marketing strategy over time.
Supporting email deliverability
A/B testing can also support stronger email deliverability. Mailbox providers use engagement signals, particularly opens and clicks, to determine whether emails are relevant to recipients. By identifying the variant most likely to generate engagement before sending the broadcast to the full audience, A/B testing increases the likelihood that more recipients will interact with the campaign. Higher engagement at scale reinforces sender reputation, which in turn supports more consistent inbox placement in future broadcasts.
FAQ
How many variants can I include in a test?
An A/B test can include up to three variants. Each variant receives an equal share of the test group.
Can I run a test with identical variants?
Technically yes, but it is not recommended. If no meaningful differences are detected between variants, the system evaluates them using a combined engagement score, which may not produce useful insights.
Can I edit variants after the test has started?
No. Once the broadcast is launched and the test phase begins, the variants cannot be edited. If changes are required, you need to stop the broadcast and create a new test.
Can I choose the metric used to compare variants?
No. Getsitecontrol automatically selects the comparison metric based on what differs between the variants. If only inbox elements differ, performance is evaluated using open rate. If only the email body differs, click rate is used. When both differ, a combined engagement score is applied.
How large should the test group be?
The optimal test percentage depends on the size of your audience. Smaller lists often require a larger test group to produce meaningful engagement data, while larger lists can generate reliable results with a smaller percentage.
Can I choose which contacts are included in the test group?
No. Contacts are assigned randomly to each variant to ensure the test samples are comparable and include a balanced mix of mailbox providers.
When does the evaluation period start?
The evaluation period begins after all test emails have been delivered, not when the broadcast is launched.
Can I stop the test early and send the broadcast immediately?
Yes. During the test phase or the evaluation period, you can manually select a winning variant using the Choose winner option on the broadcast card. When you do this, the selected variant is sent to the remaining audience right away.
Does A/B testing affect deliverability?
A/B testing can improve deliverability by increasing engagement. By identifying and sending the most engaging variant to the full audience, the broadcast is more likely to generate positive signals such as opens and clicks, which support sender reputation and inbox placement.