Create pop-up surveys for free
Start collecting feedback on your site. Select a template,
A survey popup is a short feedback form that appears over website content at the moment of your choice. It can be triggered by time on page, exit intent, or a completed action — capturing feedback while it’s most relevant, before the experience fades.
Collecting feedback in the moment is what separates pop-up surveys from email surveys and standalone feedback tools. A visitor who just abandoned a cart can explain why while the friction is still fresh. A customer on the order confirmation page can tell you how they found you and what made them choose you over alternatives.
Getsitecontrol makes it easy to add a pop-up survey to any website. It covers every common survey scenario, from abandonment and post-purchase experience to visitor intent and website navigation feedback. The template gallery gives you a starting point for each, and the targeting rules let you control exactly who sees each survey and when. There’s a free plan available, so no commitment is required.
A visitor intent survey usually appears early in the session, before a purchase or an exit. A single question — “What are you looking for?” or “What brought you here today?” — tells you whether visitors are browsing, comparing options, or ready to buy. That distinction rarely comes through in session data, but it can shape your decisions about traffic channels, content, and product presentation.
Exit-intent surveys are triggered when visitors are about to exit without taking action. A question like “What stopped you from completing your purchase today?” — framed as a genuine request for information — tends to produce surprisingly candid responses. Pricing concerns, missing product details, and unexpected shipping costs are the kinds of friction that rarely show up in analytics but surface quickly in survey responses.
Post-purchase surveys appear on the order confirmation page, immediately after checkout. A customer who has just completed a purchase is in an unusually cooperative mindset, which is why this format tends to see high response rates. A question like “What convinced you to buy?” or “What problem are you looking to solve with our product?” reveals purchase motivations that no other touchpoint in the customer journey captures.
Website feedback surveys appear mid-session, once a visitor has had enough time to form an opinion. Questions like “What could enhance your experience?” or “Is anything missing on this page?” paired with a set of checkbox options makes it easy to respond quickly. The optional open field lets those visitors who want to elaborate do so, without making it mandatory for everyone.
Product research surveys work best with returning visitors or people who have spent meaningful time on the site — those with enough experience to have an informed opinion. A question like “Is there anything you’d change about our product?” with an open field for suggestions produces structured responses that are easy to analyze at scale. The answers tend to highlight gaps that internal teams are too close to see.
The timing of a popup survey affects both response rate and data quality. A survey triggered too early reads as an interruption; one triggered too late misses the peak engagement moment. Matching the trigger to the purpose is what separates surveys that produce actionable data from those that produce noise.
The order confirmation page is a low-friction moment: the transaction is complete, and the visitor is no longer focused on taking action. Trigger a survey here to ask where they first heard about the brand, what almost stopped them from buying, or what problem they were hoping to solve.
Cart and page abandonment surveys appear when a visitor is about to leave without taking action. One appearance per session is the right frequency cap — firing on every exit attempt turns a feedback request into an obstacle. Tailor the question to the page context: the friction on a cart page is different from that on a homepage or a product page.
Scroll depth, product clicks, pricing page visits, and CTA interactions all signal clear intent. Surveys triggered by these actions tend to produce more specific responses than those shown to broad traffic, because the visitor has already demonstrated what they are interested in. Use this timing to ask targeted questions about specific features, content, or products the visitor has interacted with.
| Pop-up survey timing | Question examples |
|---|---|
| After conversion | Where did you first hear about our brand? What other products did you use in the past? What is the main reason you chose this product? |
| After a key interaction | What information are you looking for? What problem are you trying to solve today? What matters most when choosing this product? |
| On exit intent | Is there anything missing on this page? What stopped you from completing the purchase? What’s the main reason you’re leaving right now? |
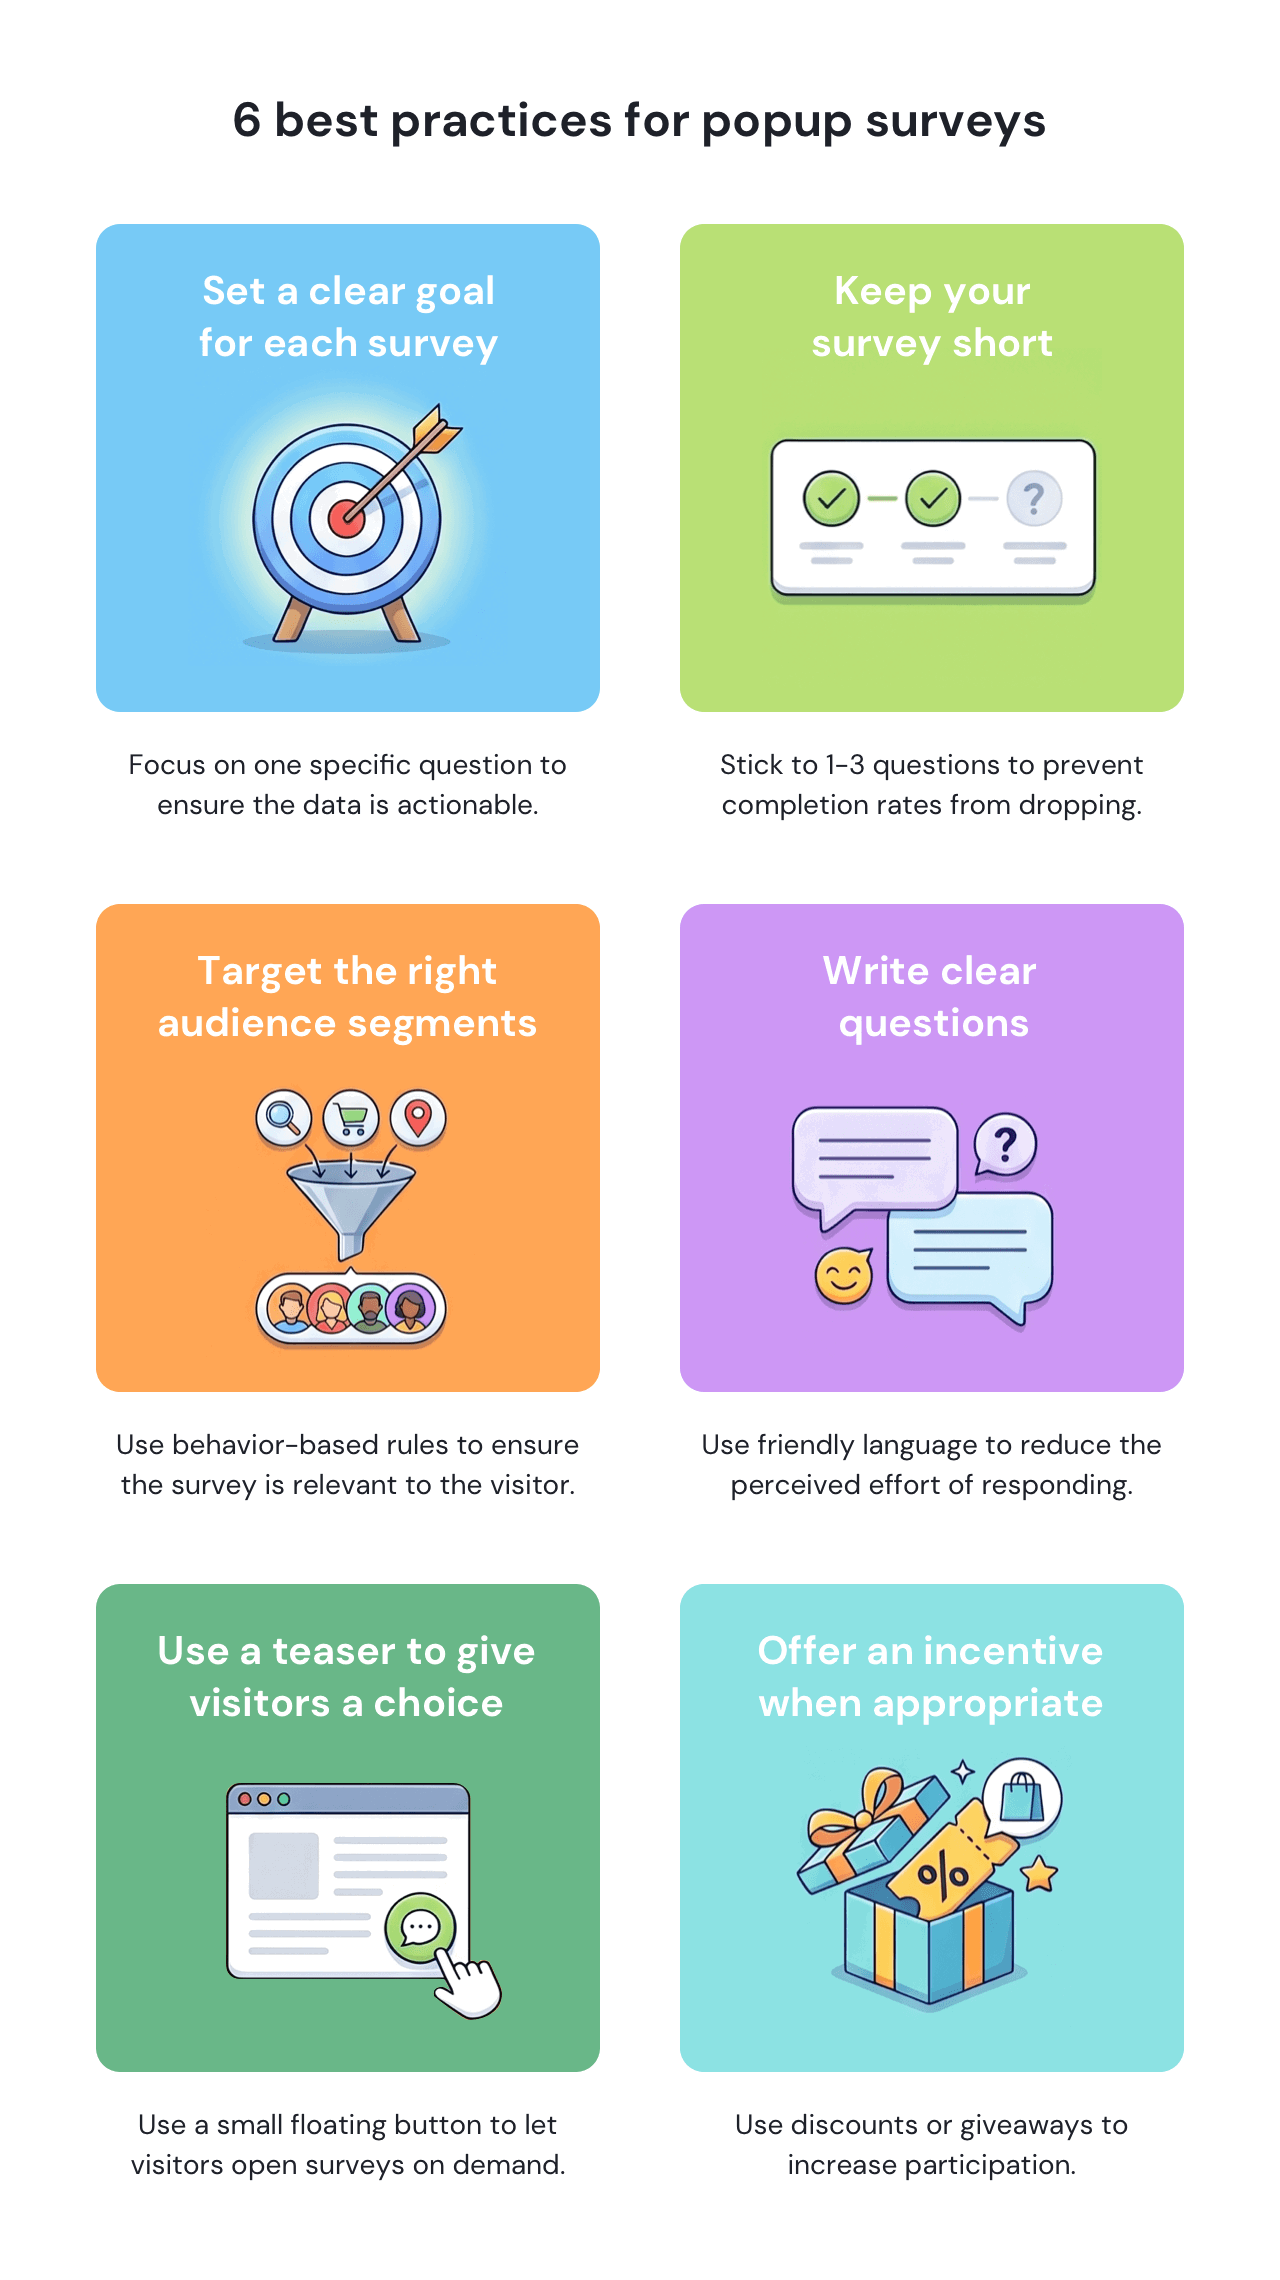
The most actionable popup surveys are built around one specific question the business needs to answer. A vague goal like “understand our customers” produces responses that are difficult to act on. A focused goal, such as “Find out why visitors leave the pricing page without requesting a demo”, determines what to ask, when to show the survey, and who should see it. Clarity of purpose at the goal level tends to produce clarity of insight in the responses.
One to three questions is the effective range for popup surveys. Completion rates drop with each additional question asked, and visitors who are willing to answer one question are not necessarily willing to answer five. For situations requiring more depth, explain how long the survey is and consider offering an incentive upon completion.
Not every survey is relevant to every visitor. Targeting rules based on traffic source, browsing behavior, visit count, or device ensure that responses come from people with enough relevant experience to answer meaningfully. Otherwise, you risk diluting the data with input from visitors who have no context for the question.
Survey questions written in formal or corporate language tend to produce considered, guarded answers rather than genuine reactions. Conversational phrasing — “What’s missing from our product range?” rather than “Please indicate which product categories are underrepresented” — reduces the perceived effort of responding and drives more honest input.
A teaser is a small floating button that keeps the survey accessible without forcing it on visitors. Instead of appearing uninvited, the survey opens on demand — which is particularly effective for incentivized surveys, where the teaser CTA can read something like “Get $15 for a 3-minute survey.” It also solves a common problem: visitors who accidentally dismiss a popup can reopen it without refreshing the page.
A discount, giveaway entry, or other incentive can increase response rates for surveys that require more effort — such as product research questionnaires with open-ended questions. For post-purchase surveys, where the customer is already in a cooperative mindset, an incentive is typically unnecessary and can shift attention away from the feedback goal.
Response rates for pop-up surveys vary by format, placement, and targeting precision. For example, pop-up surveys can achieve 20-30% completion rates, according to the research by Survey Sparrow. Compare these numbers to passive feedback buttons collecting responses from less than 3-5% of visitors.
Across industries, overall rates tend to range from 5% to 30% completion rates, with retail and ecommerce websites typically seeing 5-15% and SaaS companies averaging 8-20%, according to the same study. Well-targeted, single-question surveys consistently outperform broad surveys shown to all visitors.
Pop-up surveys help you ask visitors what they think and want, while they are still engaged with your site. Whether the goal is reducing abandonment, understanding purchase motivation, or identifying navigation gaps, the insights you need are already there — they just need to be collected at the right moment.
Getsitecontrol is ideal for adding timely survey popups to your website, even if you have no technical skills. It comes with a gallery of ready-made popup survey templates covering the most common feedback scenarios, targeting rules that let you control who sees each survey and when, popup teasers so visitors can open surveys on demand, and a free plan to get started. Getsitecontrol works on any website platform and requires no developer involvement. Create an account to see it in action.
Getsitecontrol is fantastic. It helps us get feedback from our customers (those that buy and also those that choose not to) without being too intrusive. Very easy to set up.
Online art store shopifyMost feedback methods depend on the visitor taking initiative — seeking out a form or responding to an email. Pop-up surveys collect feedback at the moment of relevance, while the visitor is still on the page and the experience is still immediate. That timing produces more accurate responses, whether the goal is understanding why someone is leaving, what convinced them to buy, or whether they found what they came for.
Pop-up surveys are commonly used to understand visitor intent, reduce shopping cart abandonment, improve navigation, validate product decisions before committing to development, and capture purchase motivation at the point of conversion. Each objective maps to a specific trigger and question format — which is what makes timing and targeting the most important decisions when setting one up.
One to three questions is the effective range for quick, non-incentivized feedback. Completion rates drop with each additional question, and the format works precisely because it asks little of the visitor. Longer surveys are still possible in popup format, but they require a different approach — being upfront about the time commitment and offering an incentive to justify the ask.
Pop-up surveys can perform well on mobile, but they require a responsive design with large tap targets and minimal required text input. Rating scales and single-choice formats tend to perform better on mobile than open-ended text fields, where typing is more effortful. Shorter questions also matter more on smaller screens, where screen space is limited.
They can, if shown too early, too often, or to the wrong audience. A survey that interrupts a visitor before they have had any meaningful experience on the page feels intrusive rather than useful. Frequency caps, session-based display limits, and audience targeting rules prevent overexposure — which is the most common source of frustration with the format.
Individual responses are rarely actionable on their own. Reviewing responses regularly to identify patterns — recurring friction points, repeated navigation complaints, common purchase motivations — is more productive than analyzing answers one at a time. Segmenting respondents by their answers also enables targeted follow-up: a visitor who reported abandoning due to shipping cost can receive an email with delivery information; one who said they couldn’t find what they were looking for can be directed to a relevant category page.
Nina De la Cruz is a content strategist at Getsitecontrol. She is passionate about helping small and medium ecommerce brands achieve sustainable growth through email marketing.
Create popups for free
Email forms, promos, coupons, surveys, bounce-stoppers.
Get started, it’s free →A floating “Contact us” button gives website visitors a direct line to your team without forcing them to search for a contact page.
Unlike traditional forms that live on separate pages, a floating button stays visible as people browse and opens a pop-up contact form instantly upon click. This approach works well for general inquiry forms, support request forms, business inquiry forms, and beyond.
An email opt-in popup is a form that appears on a website to collect email addresses, typically in exchange for a discount, early access, or useful content. For many websites, it is one of the most effective ways to grow an email list.
Unlike inline forms embedded within a page, an email capture popup appears at specific moments in the visitor journey. This can be after a user has engaged with content, viewed a product, or shown exit intent.
Discount popups are among the easiest conversion tools available to Shopify merchants. A well-timed offer gives hesitant visitors a reason to act — whether that’s completing a first purchase, returning to an abandoned cart, or joining an email list.
Subscribe to get updates
Get beginner-friendly tips for growing your online business.